Website Fingerprinting Lab
Due Date: Feb 15; Last Updated Date: Feb 1
Table of Contents
- Introduction
- Part 1: Warm-up (20%)
- Part 2: Side Channel Attacks with JavaScript (60%)
- Part 3: Root Cause Analysis (20%)
- Takeaways
- Contributors
Lab Details
Collaboration Policy
Our full Academic Honesty policy can be found on the Course Information page of our website. As a reminder, all 6.5950/6.5951 labs should be completed individually. You may discuss the lab at a high level with a classmate, but you may not work on code together or share any of your code.
Getting Started
This lab is done on your own computer, and should be (micro)architecture agnostic. If you don’t have a device to use, please reach out to the TA.
You will complete this lab primarily in Python and JavaScript.
We are using git for all the labs – instructions for setting up the git repository can be found on the labs page.
In addition to submitting code, you are required to submit a PDF lab report containing your answers to Discussion Questions to gradescope. We provide a markdown template in the starter code (report.md).
Introduction
In this lab, you will complete the following tasks:
- Launch an end-to-end side-channel attack to conduct website fingerprinting.
- Try to understand the root cause of this attack.
What is website fingerprinting?
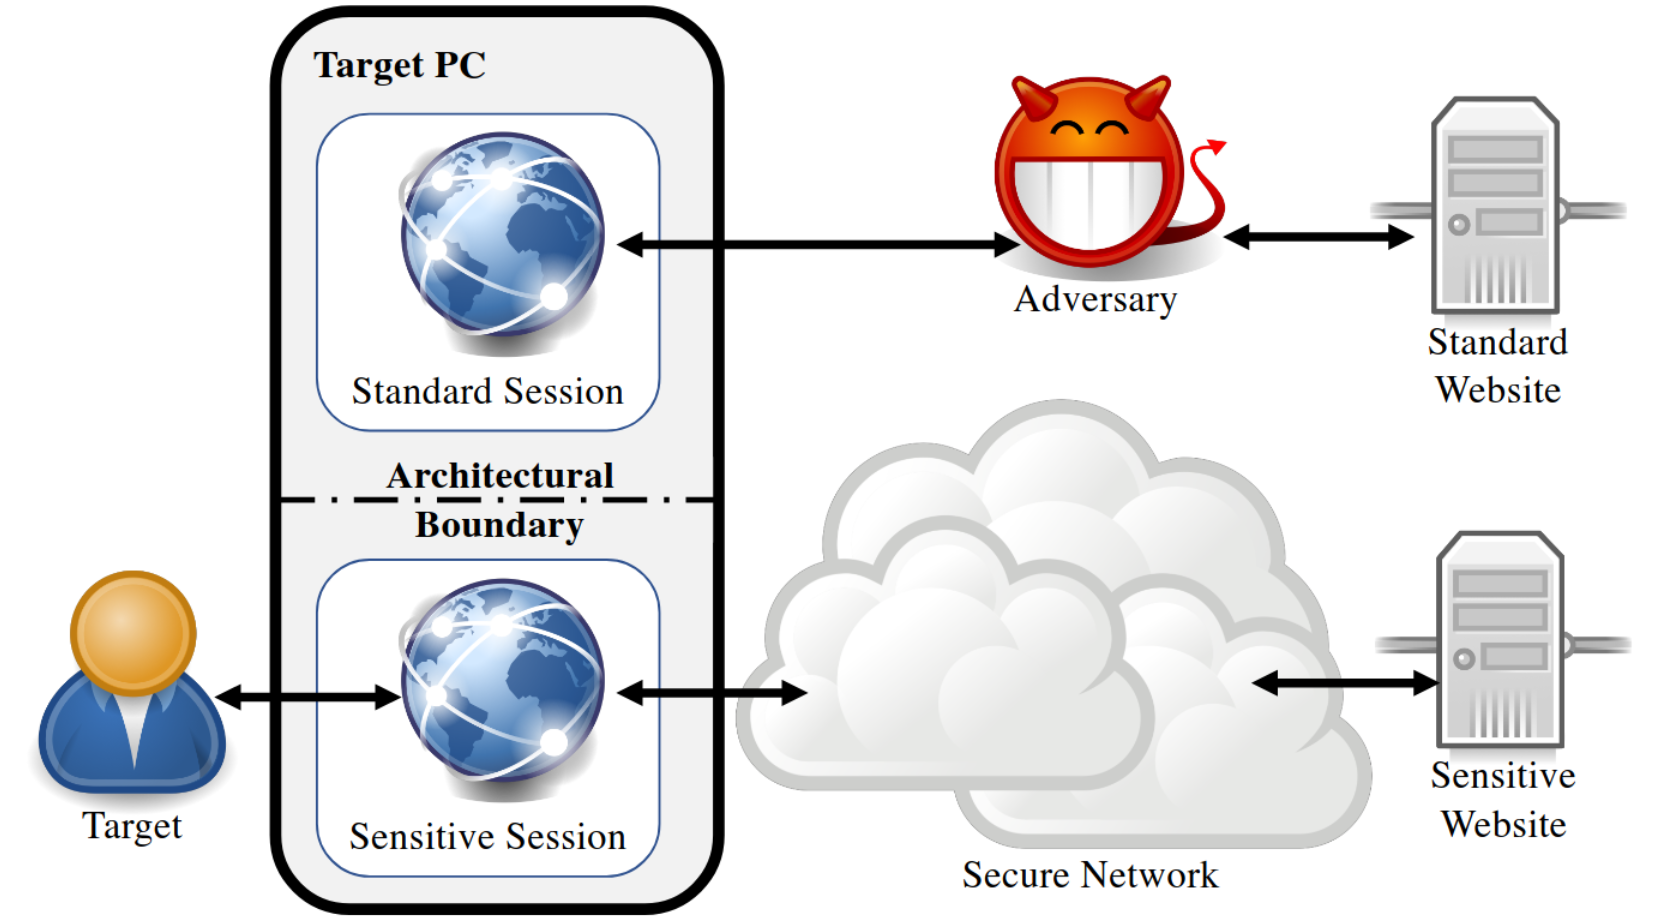
In a website fingerprinting attack, an attacker tries to distinguish which website a victim has accessed on their machine. Website fingerprinting attacks can allow an attacker to gather a lot of user information, such as political views, religious beliefs, and sexual orientation. There exist many variants of website fingerprinting attacks, which we can classify into two categories (based on the resources that the attacker can access): on-path attacks and co-located attacks.
An on-path attacker executes on a different machine from the victim. The attacker observes all network packets sent and received by the victim’s machine and infers the website based on the timing and size of the observed network packets.
In contrast, a co-located attacker executes on the same machine and shares microarchitectural resources with the victim, including caches, DRAM, and GPUs. In the case of a low-privileged attacker, this co-location can be achieved by running attacker-controlled JavaScript code in a different browser tab. We focus on co-located attacks in this lab.
Example of co-located attack setup (source)
What is the plan?
You will implement a variant of cache-occupancy side-channel attacks, called Sweep Counting Attack. This attack was originally described in the following two papers. Reading these two papers is not required to complete the lab, however they discuss several other attack techniques that you may find inspiring.
- Robust Website Fingerprinting Through the Cache Occupancy Channel: Section 4.1, Page 8, Website Memorygrams.
- Prime+Probe 1, JavaScript 0: Overcoming Browser-based Side-Channel Defenses: Section 3.1, Page 5, Sweep Counting.
You will demonstrate the attacks mounted from inside a web browser (a restricted execution environment). A browser usually cannot access fine-grained timers, cache-flushing instructions, or manipulate low-level memory. As such, after you complete this lab, you will hopefully see how versatile side channels are.
Our plan of attack involves 1) writing JavaScript code to collect side-channel traces; and 2) using machine-learning techniques to analyze the traces we collect. Knowledge of the internal machine-learning techniques and mechanisms is not required. Instead, the goal is to allow you to use ML as a black-box tool.
The attack you’ll develop in this lab should work in any web browser, including Chrome, Firefox, Safari, and even the Tor browser.
Discussion Question (Optional)
Report your browser version, CPU type, cache size, RAM amount, and OS. We use this information to learn about the attack’s behavior on different machines.
Part 1: Warm-up (20%)
In this part, you will familiarize yourself with the development environment and determine the timer resolution offered by JavaScript.
Code Structure
warmup.js: A JavaScript file with two functions,measureOneLineandmeasureNLines, which you will complete.warmup.html: A webpage that displays the return values of the two functions.
Hello World (Optional)
As a warm-up exercise, we will guide you through JavaScript development by writing a simple Hello World program. If you’re familiar with JavaScript, feel free to skip to Timing Measurement. Otherwise, here we provide a brief overview of JavaScript and the developer tools you’ll need for this lab.
By including <script src="warmup.js"></script> on line 31 of warmup.html, your browser downloads, runs, and executes the script’s contents immediately upon loading warmup.html. You can test this by adding a simple print function like console.log("Hello World!"). You can then view the console by right-clicking the page, selecting Inspect (Cmd-Opt-I on MacOS or F12 on Windows/Linux), and then selecting Console. In Safari, you may need to unlock inspect mode with Safari > Preferences > Advanced > Show Develop Menu.
You can use console.log to debug your JavaScript code. JavaScript’s basic syntax is fairly similar to other languages you might be familiar with, such as C or Java. If you need to review JavaScript’s syntax while completing this lab, feel free to refer to various online resources.
Exercise (Optional)
Add a
console.logstatement with a message of your choice, anywhere inwarmup.js. Then, openwarmup.htmlin your web browser and check the console to ensure that your message is displayed.
Timing Measurement
Before we can execute a timing side-channel attack, we need to determine the quality (i.e., resolution) of the timer. The JavaScript’s timer (in milliseconds) can be accessed via the performance.now() API. This API yields different resolutions depending on the browser – the resolution is 0.1 ms in Chrome 92, and 1ms in Firefox 91. In warmup.js we provide measureOneLine(), an example of how we can measure the access latency of a single memory access using performance.now(). You should see the following output when you open warmup.html in a browser (you may occasionally see some non-zero entries).
Website Fingerprinting Lab Warmup

1 Cache Line: [0, 0, 0, 0, 0, 0, 0, 0, 0, 0]
N Cache Lines: []
Your first task is to determine the timing resolution of performance.now() by measuring the latency of accessing multiple cache lines. Report the observed value for accessing N cache lines, where N ranges from 1 to 10,000,000. Feel free to access the memory in sequential order, as we are trying to get a rough idea about the timing resolution. You can ignore any potential effects of hardware prefetching. Since you may not get consistent results each time due to system noise, perform the measurement 10 times and report the median access latency.
A cache line != A single element in an array
A cache line is different from an element in an array because they have different sizes. The cache line size of your machine is likely 64 or 128 Bytes. If you are not sure, you can use
getconf -a | grep CACHEif you are running Linux or usesysctl -a | grep cachelinesizeif you are running MacOS. Once you figure out the cache line size, you will want to access an array with a specified stride to make sure each access targets a different cache line.
1-1 Exercise
Complete
measureNLines()such that it measures the access time of N cache lines 10 times and pushes each measurement to the end of theresultarray. These values will be displayed onwarmup.htmlwhen you refresh the page.
1-2 Discussion Question
Use the values printed on the webpage to find the median access time and report your results as follows.
- Feel free to find the median value by hand (you are not required to implement the code to do statistic calculation).
- In the case that your browser complains about the buffer size that you request is too large (with an “out-of-memory” error), you can fill in the corresponding entry with “N/A”.
Number of Cache Lines Median Access Latency (ms) 1 10 100 1,000 10,000 100,000 1,000,000 10,000,000
1-3 Discussion Question
According to your measurement results, what is the resolution of your
performance.now()? In order to measure differences in time withperformance.now(), approximately how many cache accesses need to be performed?
Submission and Grading
You need to submit part1/warmup.js to your assigned GitHub repository. You should not modify any other files.
Part 2: Side Channel Attacks with JavaScript (60%)
The Sweep Counting Attack
In a cache-occupancy attack, the attacker leverages the fact that the attacker and victim share the same cache hierarchy. As such, an attacker can monitor its own cache access latency to estimate how much of the cache is occupied by the victim and infer the victim’s behavior. For example, consider an attacker which accesses each element of a Last Level Cache (LLC) sized buffer prior to the victim’s execution. When the victim subsequently performs a lot of memory accesses, it will evict the attacker’s buffer from the cache, and the attacker will observe a longer latency when it re-accesses the buffer. As such, the attacker’s own memory access time is roughly proportional to the number of cache lines the victim accessed.
The sweep counting attack is a variant of these cache-occupancy attacks, particularly suited for the case when the attacker is restricted to using low-resolution timers. The attacker allocates a Last Level Cache (LLC) sized buffer and sequentially accesses each cache line in the buffer (like what you have done in Part 1). We call one round of scanning the buffer “one sweep over the LLC.” Then, the attack works by counting how many sweeps over the cache can fit into a single time window whose length is P ms. P ms is on the order of a few milliseconds, and it is a parameter chosen by you. You will repeatedly perform sweep counting for 5 seconds, so that the counters you gather can form a trace with the length as K, where K = 5000/P.
Part 2.1: Cache Trace Collection + Processing
Let’s start with implementing the sweep counting attack to collect cache traces in JavaScript. In this attack, the victim code and attacker code resides in two separate JavaScript environments. They can be within two different browser tabs, or entirely separate web browsers on the same machine. The attacker tab will create two threads: a main thread that handles user interactions (e.g., clicking website buttons) and a worker thread that executes your provided code in the background. Note that the worker thread runs even if the attacker tab is not in the foreground.
Setting Up The Web Server
To run the worker thread, modern web browsers require that you load the page from a server (rather than simply opening index.html as a file). To get around this issue, you can develop your code by running a simple web server using the following commands, run from the part2/ folder. Make sure you’re using Python3 for this step (and the rest of the lab).
$ cd part2
$ python3 -m http.server
Serving HTTP on :: port 8000 (http://[::]:8000/) ...
Web browsers typically cache the worker thread upon loading the page, so you will need to change your browser’s settings to load updates you make to worker.js. Follow the instructions here in order to do this. If this doesn’t work for you, you can force a refresh of the service worker by opening your worker script at http://localhost:8000/worker.js, holding down shift while clicking the refresh button in your browser’s toolbar, and manually checking that the file’s contents match what you expect.
Trace Collection
Open http://localhost:8000 in your preferred web browser. Pressing Collect Trace will begin a countdown, which you can use to prepare your experiment (i.e., switching to a new window). At the end of the countdown, the worker will trigger record(), which will be written by you in worker.js. The output of this function is displayed as a 1D heatmap for convenience. You can click this button multiple times without refreshing the window in order to collect multiple traces. Clicking Download Traces will allow you to download all of the traces collected in a JSON format.
You will implement the sweep counting attack inside the record() function. Feel free to refer to the description of the attack at the beginning of Part 2. If you have difficulty in making the attack work, you can also refer to the pseudocode in There’s Always a Bigger Fish: A Case Study of a Misunderstood Timing Side Channel Figure 2.
Trace Processing
You can process these downloaded traces in Python with code such as the following:
import json
import numpy as np

with open("traces.json", "r") as f:
    # Load contents from file as JSON data
    data = json.loads(f.read())

    # Convert 2D array into Numpy for data processing
    traces = np.array(data["traces"])

    # Labels are only available with the automation script.
    # Use the line below in part 2.2 onward to access them.
    # labels = data["labels"]

# Example data analysis
print(traces.mean())
Such traces can be used to distinguish different system events. The below image shows three traces that were collected under the following circumstances:
- Do nothing while the trace is collected
- Add random system activity, moving the mouse during trace collection
- Open
nytimes.comin a new window during trace collection
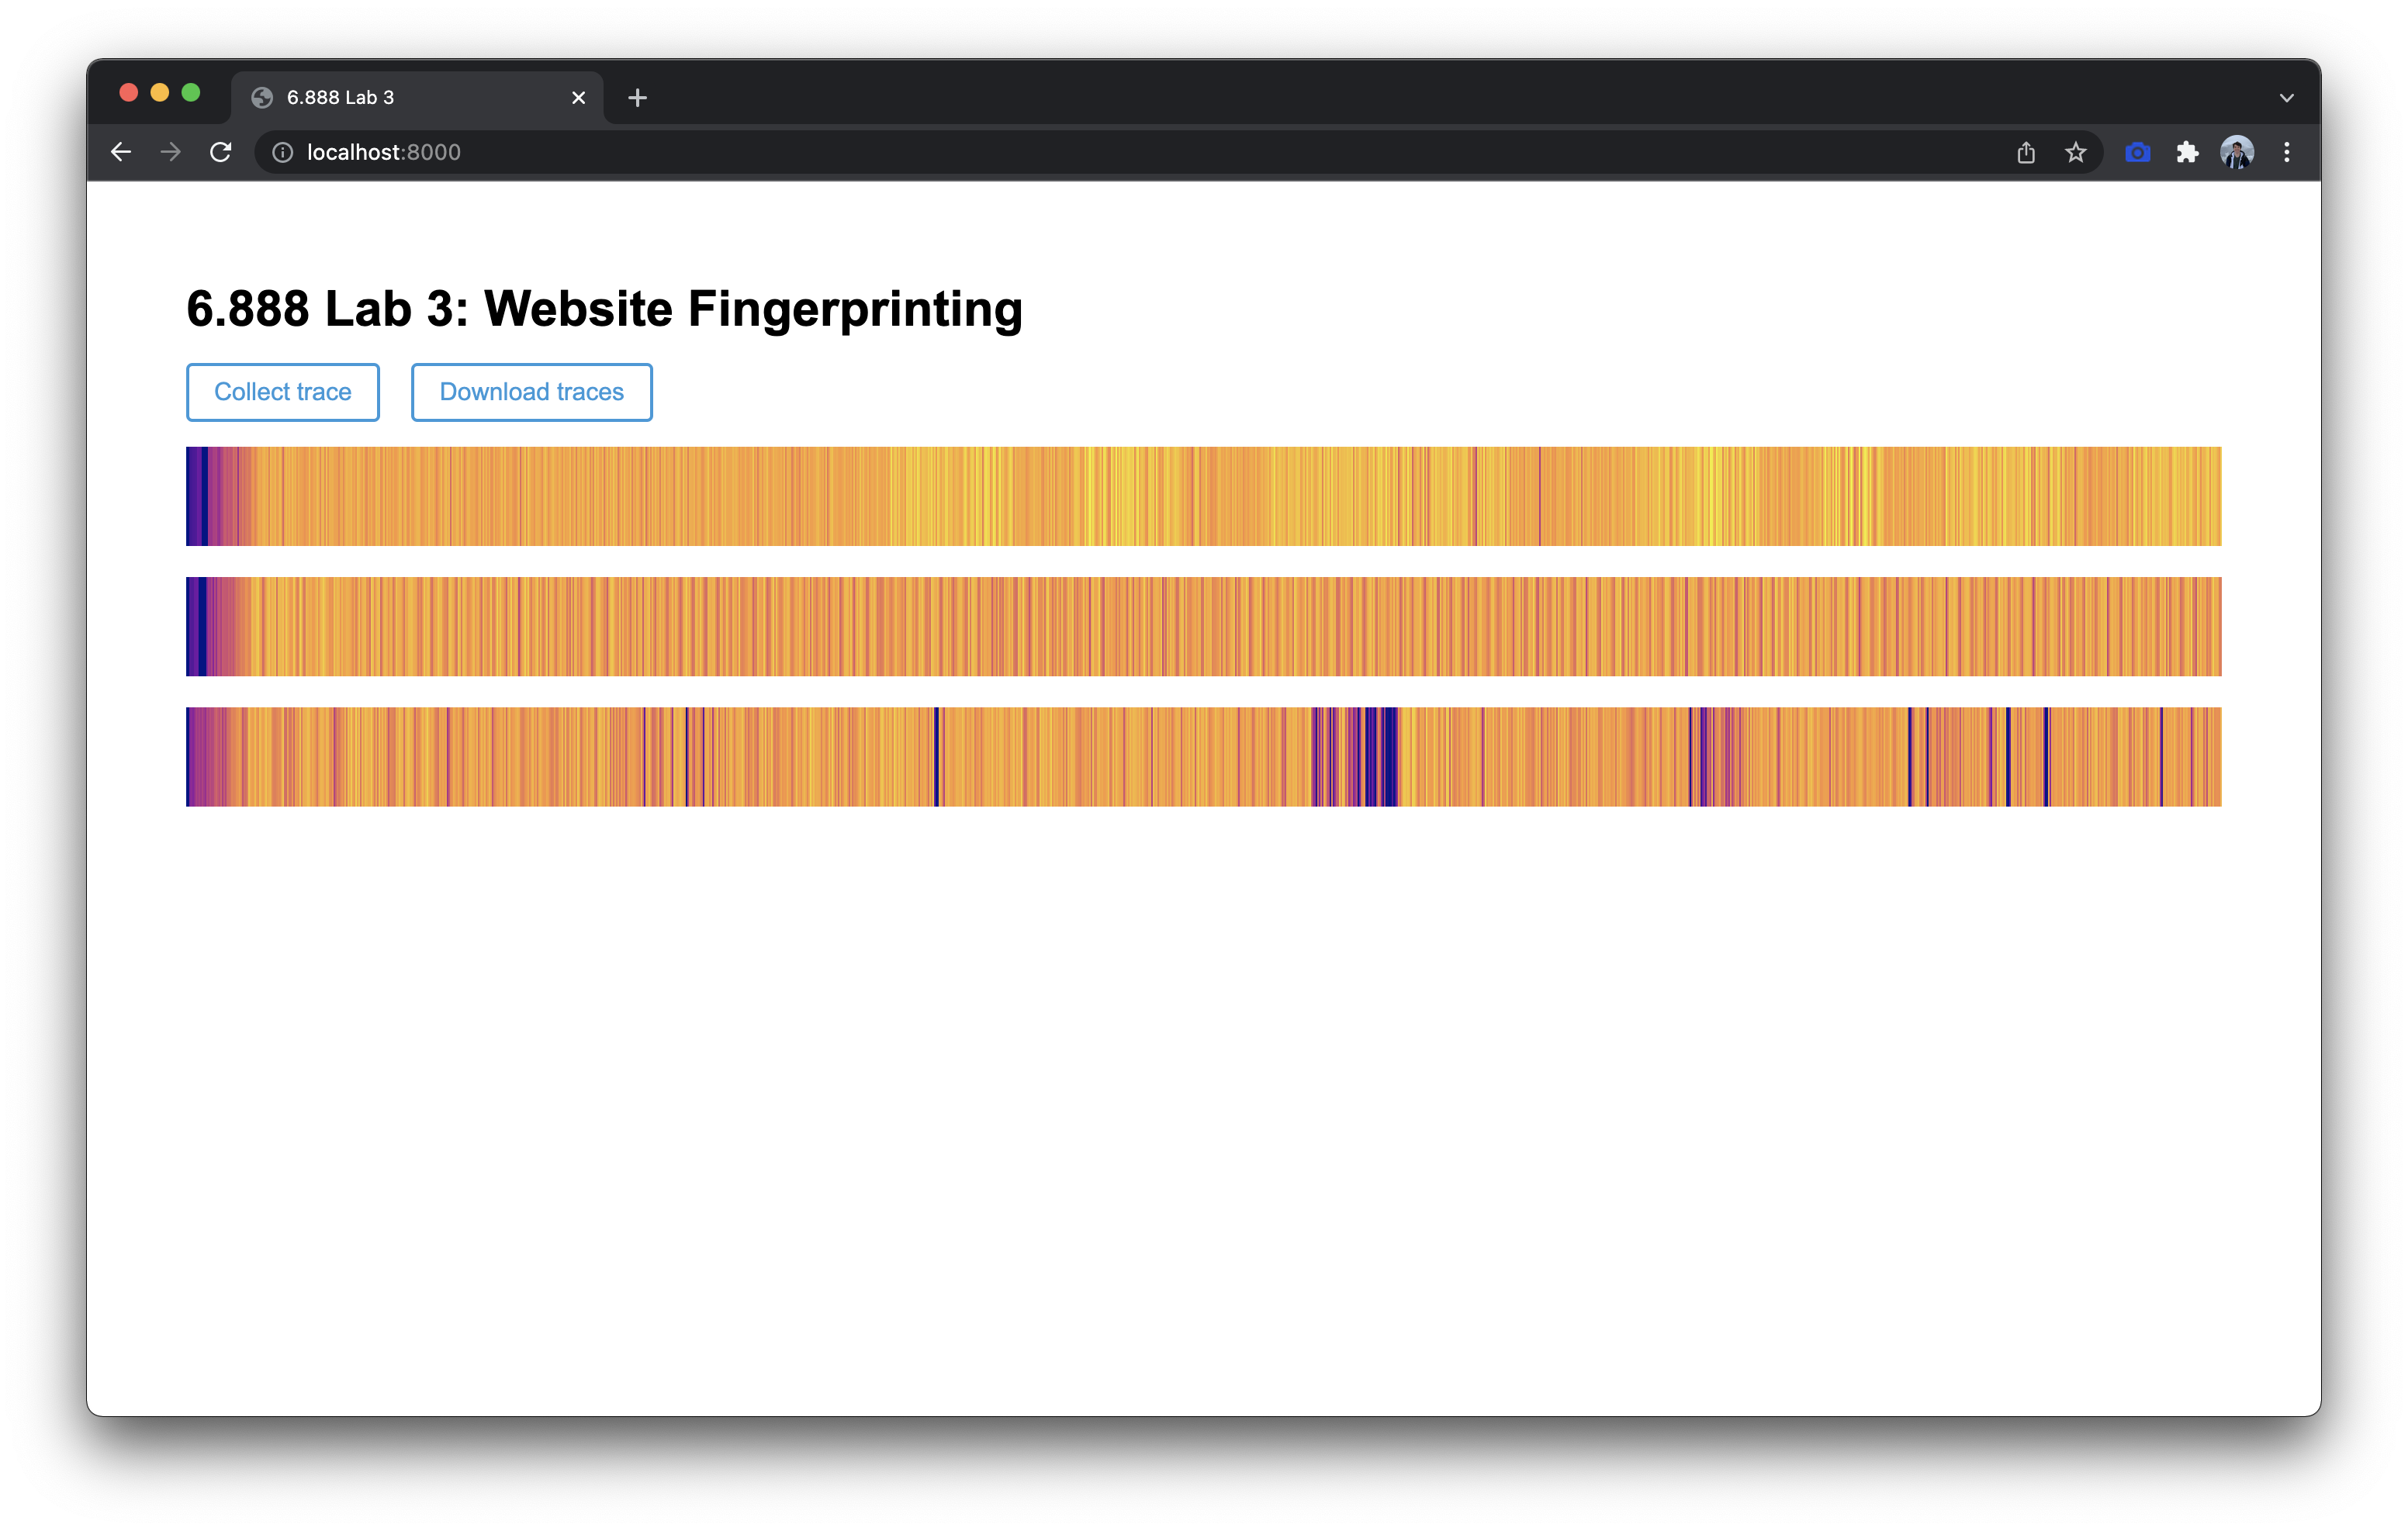
2-1 Exercise
Complete the
record()function inworker.js. Experiment with different P values and collect traces for the three scenarios above for the best value of P you find. Your traces will not exactly match those in the provided example, but they should be visually distinguishable from one another.
2-2 Discussion Question
Report important parameters used in your attack. For each sweep operation, you access N addresses, and you count the number of sweep operations within a time interval P ms. What values of N and P do you use? How do you choose N? Why do not you choose P to be larger or smaller?
2-3 Discussion Question
Take screenshots of the three traces generated by your attack code and include them in the lab report.
Part 2.2: Automated Attacks with Machine Learning
It is tedious and unreliable to launch the victim website manually. To automate the attack process, we provide an automation script (automate.py) based on the Selenium browser automation framework for you to use.
Installing Drivers
To complete this section, you will need to install Flask, Selenium, and SciKit-Learn. Make sure you are using Python 3 and install these modules with python3 -m pip install flask selenium scikit-learn.
If you do not want to change your defualt Python environment, you can use Python’s support for Virtual Environment
Selenium should automatically install the latest drivers for the browser(s) you have installed. If you are encountering running Selenium, try manually installing the driver using option 3.
Using the Automation Script
You can test the automation script by collecting a few traces while your victim opens different websites using the following commands:
$ python3 automate.py
    --part 2
    --domains google.com,nytimes.com
    --num_traces_per_domain 4
    --out_filename traces.out
Detailed descriptions of the arguments used by the automation script can be found by executing python automate.py --help:
usage: automate.py [-h] [--browser {chrome,firefox,safari}] [--domains DOMAINS]
                   [--num_traces_per_domain NUM_TRACES_PER_DOMAIN]
                   [--trace_length TRACE_LENGTH] --out_filename OUT_FILENAME --part {2,3}

optional arguments:
  -h, --help            show this help message and exit
  --browser {chrome,firefox,safari}
                        Browser to run automation in.
  --domains DOMAINS     Comma-separated list of domain names to collect traces from. Defaults to
                        google.com,youtube.com,baidu.com,facebook.com
  --num_traces_per_domain NUM_TRACES_PER_DOMAIN
                        Number of traces to collect per domain.
  --trace_length TRACE_LENGTH
                        The length of each recorded trace, in milliseconds.

required arguments:
  --out_filename OUT_FILENAME
                        Name of the output file to save traces to.
  --part {2,3}          Set to the part of the lab you're working on.
We recommend starting with a few traces from google.com and nytimes.com. Google is a lightweight website with mostly static content, while NYTimes is a heavyweight website that loads many assets, making them easy to distinguish.
2-4 Discussion Question
Use the Python code we provided in Part 2.1 to analyze simple statistics (mean, median, etc.) on the traces from google.com and nytimes.com. Report the statistic numbers.
Using Machine Learning for Classification
Let’s now design a more advanced attacker. Instead of collecting four traces on two websites, we’re going to collect 20 traces on four different websites. As we’re collecting five-second traces, this will take about 7 minutes to run. Pick four of your favorite websites (school appropriate / G-rated) to classify between, pass them to the domains argument, and leave your computer alone until it’s done (to avoid introducing unnecessary noise to your attack).
$ python automate.py
    --part 2
    --domains website1.com,website2.com,website3.com,website4.com
    --num_traces_per_domain 20
    --out_filename traces.out
Once the script has finished, you should divide your traces into a training set with 16 traces from each site, and a testing set with 4 traces from each site. The training set is used to train a machine learning model, and the testing set is used to evaluate its accuracy once training is complete. We recommend using the train_test_split function from the scikit-learn library, with test_size=0.2. Then, train a RandomForestClassifier (or another classification model of your choice from scikit-learn) on your training set. Finally, use your model to predict labels for the testing set, and check your model’s accuracy with scikit-learn’s classification_report function. An example classification report is shown below.
                         precision    recall  f1-score   support

   https://www.baidu.com      1.00      1.00      1.00         4
  https://www.google.com      1.00      1.00      1.00         4
https://www.facebook.com      1.00      0.75      0.86         4
 https://www.youtube.com      0.80      1.00      0.89         4

               accuracy                           0.94        16
              macro avg       0.95      0.94      0.94        16
           weighted avg       0.95      0.94      0.94        16
2-5 Exercise
Complete the
eval()function in eval.py. In this function you should:
- Load your traces into memory
- Split your data into a training and test set
- Train a classification model on your training set
- Use your model to predict labels for your test set
- Print out your model’s accuracy using
classification_reportUse your
eval()implementation to analyze the traces that you collected for four websites and print the classification result. Remember to include the tracespart2/traces.outin the Github repo to get full credit for this exercise.
Exercise (Optional)
Try different machine learning models to see whether you can improve on the accuracy of your previous scheme.
2-6 Discussion Question
Include your classification results in your report.
Submission and Grading
You need to submit the code you changed (mainly part2/worker.js and part2/eval.py)and traces (part2/traces.out) to your GitHub repository. The accuracy (i.e. the accuracy f1-score reported in the classification report) can be affected by the websites you choose as well as your web brower versions. Anything higher than 60% accuracy will recieve full credit.
In most cases, you should easily be able to achieve 80% accuracy. If your accuracy is lower than 60%, try some websites with more distinguishable content, or try an older version of the web brower. We observe Chrome 98 or earlier works well for MacOS and Chromium 113 works well for Ubuntu. If you still have trouble, reach out to TAs.
Part 3: Root Cause Analysis (20%)
Machine-learning-assisted side-channel attacks are very powerful as they are able to find correlations across traces and can tolerate medium to heavy amounts of noise. A key challenge with using machine learning, however, is that it doesn’t provide us insight as to why an attack works. Given that JavaScript is a high-level language, we do not have full control or knowledge of the instructions being executed on the processor, nor do we have a good idea of where our signal is actually coming from!
In this part, you will try a slightly modified attack to learn about the pros and cons of ML-driven attacks. So far, we have implemented the sweep counting attack, a variant of the cache-occupancy attack. As the name of the attack suggests, this attack leaks information via cache interference. But what if we remove the cache accesses in the code? Will the attack still work?
3-1 Exercise
Copy your
record()function frompart2/worker.jstopart3/worker.jsand modifyrecord()by removing all memory accesses in your code. After removing the memory accesses, all that will remain in loop body is an add operation for incrementing a counter. Therefore, what you end up doing is counting the number of times you perform the add operation within a time window of length P ms.Then re-collect the traces for the four sites you previously examined and report the accuracy. Remember to include the traces
part3/traces.outin the Github repo to get full credit for this exercise.
3-2 Discussion Question
Include your new accuracy results for the modified attack code in your report.
3-3 Discussion Question
Compare your accuracy numbers between Part 2 and 3. Does the accuracy decrease in Part 3? Do you think that our “cache-occupancy” attack actually exploits a cache side channel? If not, take a guess as to possible root causes of the modified attack.
Note: Without detailed investigation, you will not be able to verify your answer to this question. We will give full credit as long as the reasoning behind your guess is logical.
If you’re curious as to the reasons why, we recommend reading the paper There’s Always a Bigger Fish: A Case Study of a Misunderstood Timing Side Channel. We will also discuss this paper in one of the recitation sessions.
Submission and Grading
You need to submit your code (part3/worker.js) and the traces (part3/traces.out) to your GitHub repository. Anything higher than 60% accuracy will recieve full credit.
Takeaways
Congratulations on finishing the website fingerprinting lab. We hope your very first experience with the side-channel attack in this class went well. After completing this lab, it would be valuable to recap and think about what you have learned.
As the developers of the lab, we hope that, in addition to giving you a taste of attack engineering, the lab can enlighten you with the following takeaway message: Side channels are versatile in modern systems, and with the help of machine learning techniques, they become easier to pull off. However, finding the root cause of a side channel now presents as a new challenge.
Contributors
Jack Cook, Mengjia Yan, Joseph Ravichandran and Peter Deutsch.