Binary Exploitation and RISC-V Warmup
Table of Contents
- Instruction Reference Table
- Calling Convention
- GDB Debugging
- Binary Exploitation and CTF Tools
- Privileged Extensions
- Hands-on Puzzles
In case your RISC-V assembly is a bit rusty, here’s a quick guide to the rv32i ISA, standing for RISC-V 32-bit Base Integer Instruction Set. We will also go through a few recitation exercises to get you familiar with binary exploitation that will come in handy in the fuzzing lab.
In RISC-V, there are 32 general-purpose registers (x0 to x31) and a program counter (pc). All the registers have the bit-length of 32. x0 is hardcoded to always be zero when read, and the remaining registers (x1-x31) are free for programmer use. The program counter pc points to the current instruction being executed. Each instruction is 32-bits long (4 bytes) and is always byte aligned. For things not covered in this recitation, you should refer to
Instruction Reference Table
In the assembly code, you could write instructions that are directly implemented by the hardware. You could also write pseudo instructions, which are just convenient syntactic sugar and the assembler could translate them into instructions directly implemented by the hardware. Here is a reference of these instructions and their assembly code format:
- RISC-V assembly format of instructions directly implemented by the hardware and pseudo instructions
Calling Convention
The RISC-V ISA defines a calling convention (application binary interface, or ABI), assigning meanings to the general purpose registers. The following is a breakdown of all of the registers and their meanings. Note how each register (x1-x31) has a corresponding ABI name. In assembly, you can refer to the register using either. For example, x2 means exactly the same register as sp (one is simply more readable than the other). The reference file is:
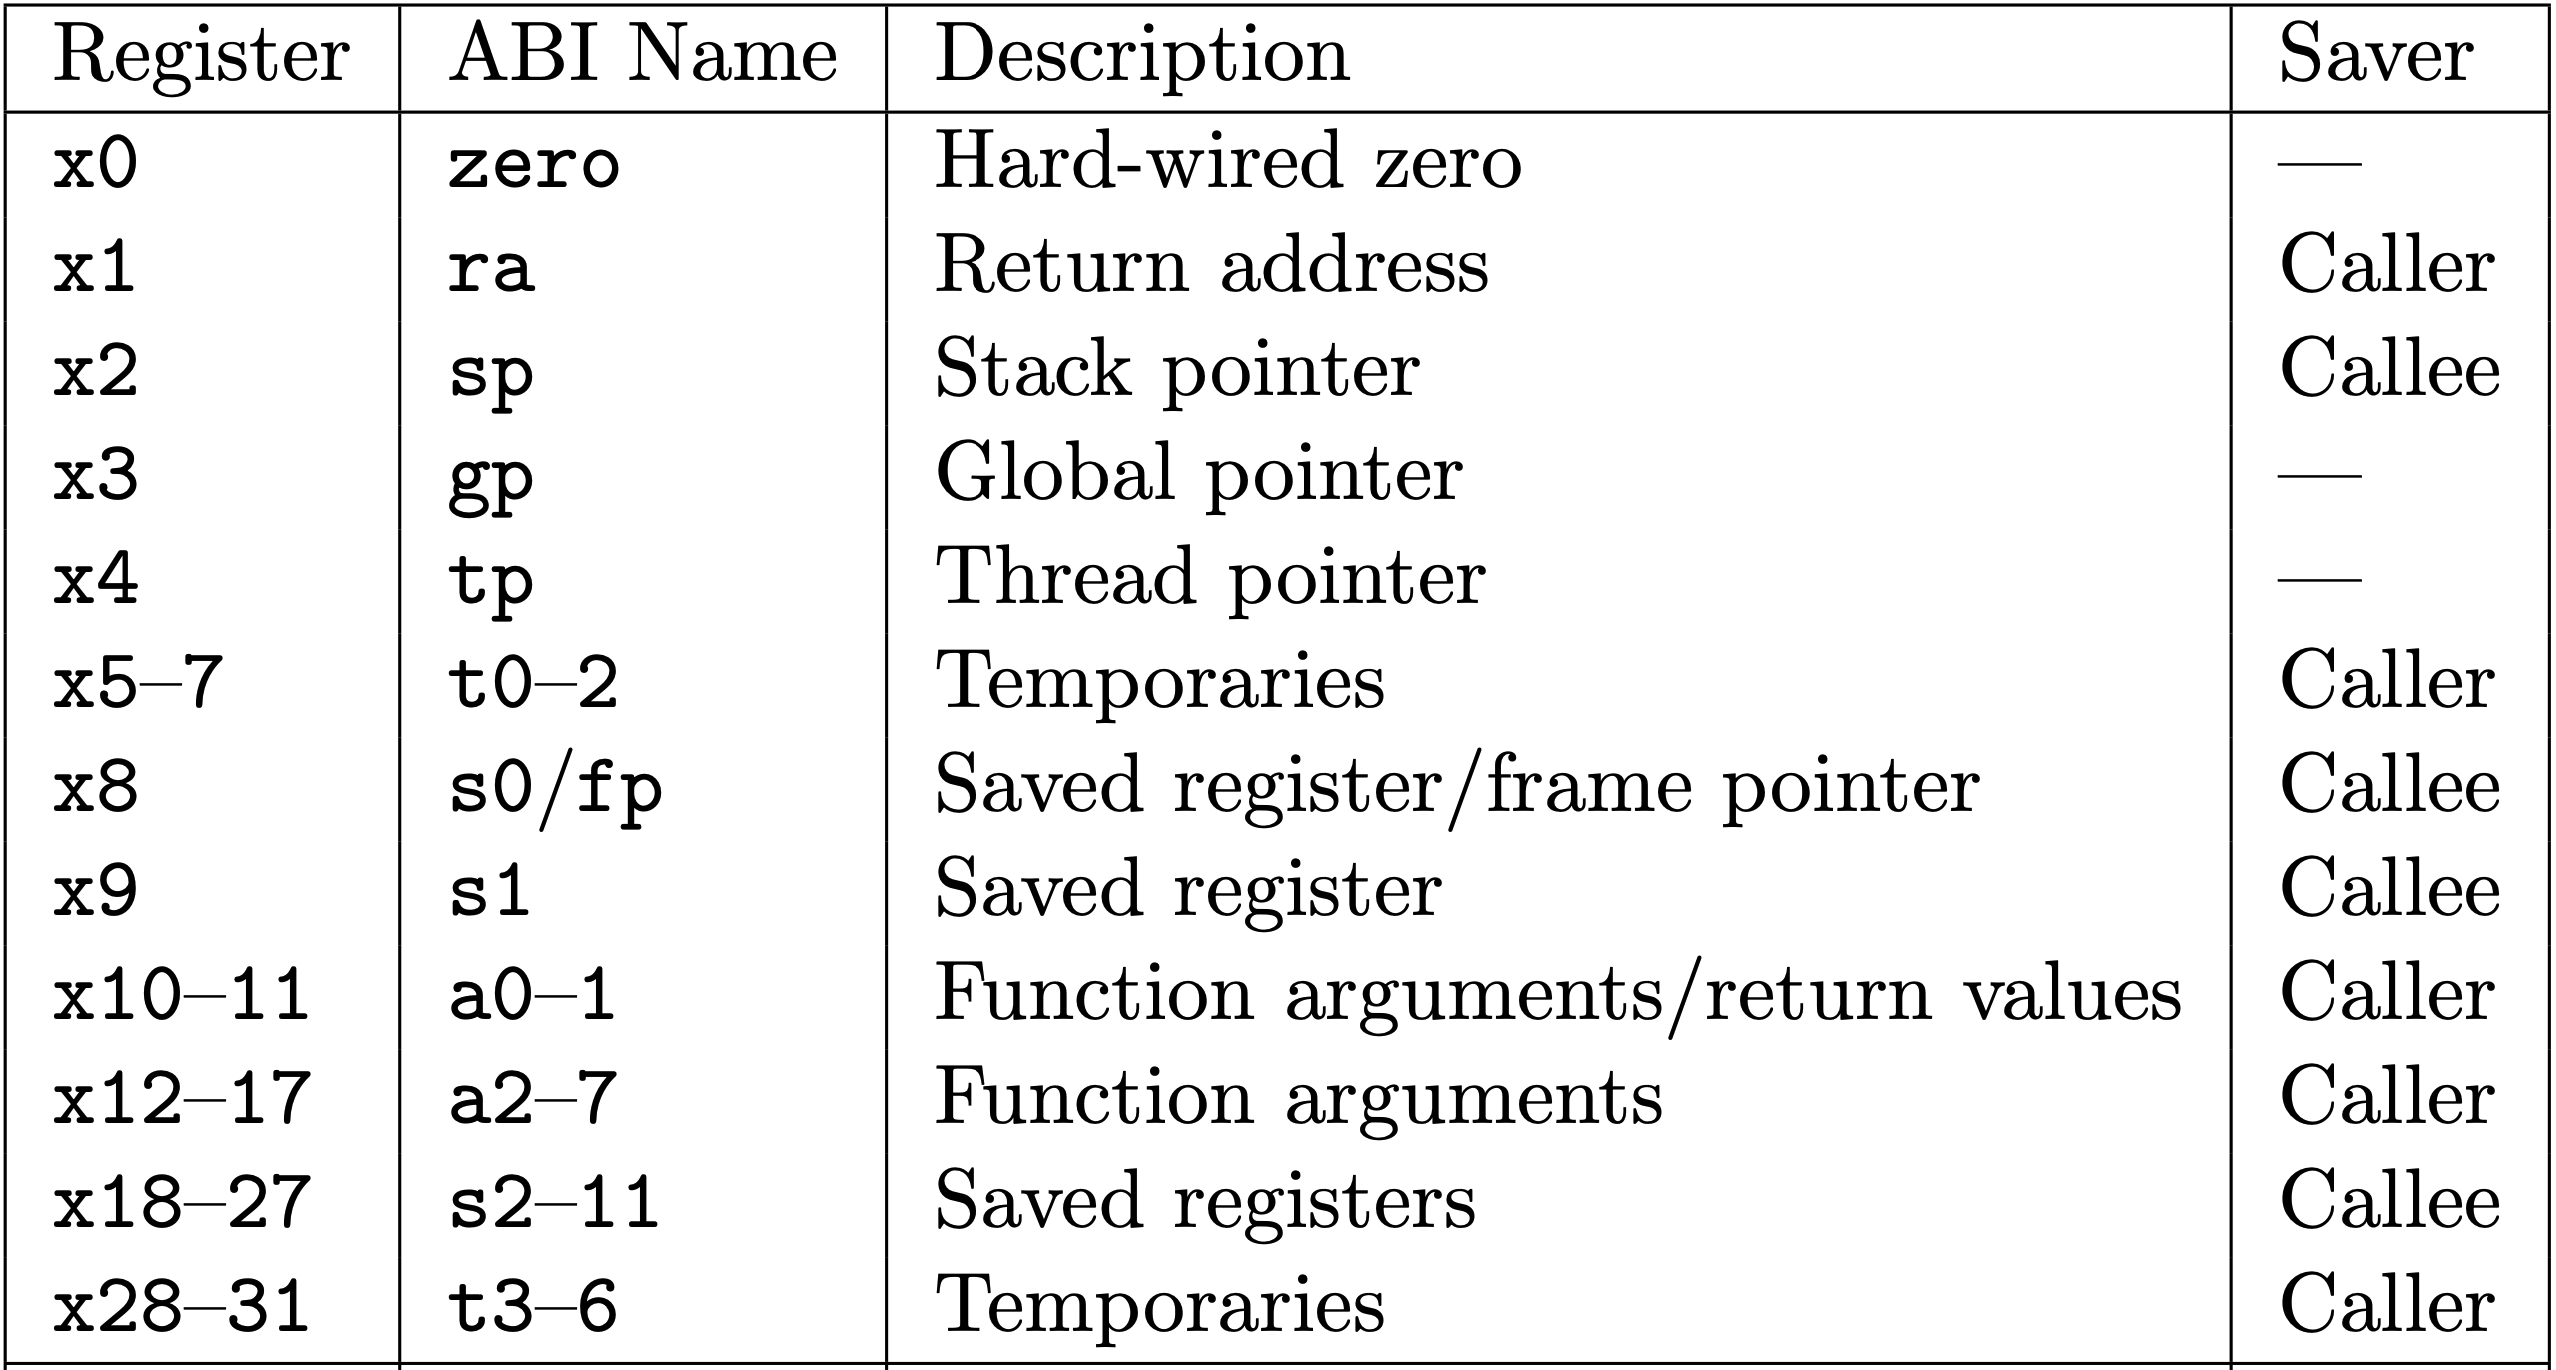
Table 18.2 from the RISC-V Calling Convention: RISC-V calling convention register usage.
Caller-saved vs. Callee-saved Registers
Since functions tend to modify registers as part of their execution, the ABI splits the registers into two kinds: callee-save or caller-save. Registers that are defined to be callee-saved need to be saved and restored by the callee (the function being called). That is, functions need to save and restore these registers. On the other hand, registers defined to be caller-saved are allowed to be changed freely by a function being called (you don’t need to save and restore these). However, a function that calls other functions should not assume these registers hold their value across method calls.
In RISC-V, all arguments are passed via registers (and the stack if there aren’t enough registers). Refer to the calling convention document for the specifics, but at a high level, arguments are passed via a0, a1, a2, and so on. When a function is complete, the return value is passed via a0 (and a1 if needed).
Function Call Linkage
The RISC-V instruction to call a method is jal (Jump and Link). jal allows the program to jump to a function (setting pc to the function to execute), and records the next instruction after jal (pc+4) into the return address register ra.
When a function is ready to exit, it executes the ret instruction. This is not a “real” instruction, rather, ret is a shorthand way of writing jalr x0, ra to jump to the return address (effectively undoing the original jalr that brought us into the function!)
Stack Management
The function must save and restore any registers it uses to the stack. In the beginning, a function will make some space on the stack (by subtracting from sp, the stack pointer), and save any necessary registers in the new space. At the end, the function will teardown its stack frame by restoring any saved registers, and resetting sp to its original value before executing ret.
A function can also use the stack for storing local variables.
Level 1
Let’s start with solving our Hands-on Puzzle level 1 to get familiar with commonly used RISCV instructions and the calling convention.
GDB Debugging
If you are experiencing crashes and don’t know why when working with C or assembly code, you can use GDB to help figure out where your exploit is going wrong.
We will go through an example of running GDB on the starter code of level 1.3 (after level 1.1 and 1.2 are done) on unicorn.
Set DEBUG_PORT in config.sh using the debug port we emailed you for lab6.A, it should be within [5100, 5300].
Run the level 1.3 code with --debug enabled:
$ ./run.sh level1 --debug
Waiting for debugger on port XXXX...
Open another terminal and run gdb with:
$ ./gdb.sh level1
...
Reading symbols from build/level1...
Remote debugging using localhost:XXXX
0x00001000 in ?? ()
(gdb)
It will pause the execution right before the program starts. Now, for debugging, you probably want to pause the execution at a specific point in the program, which is called “breakpoint”. To do so, you first create a breakpoint, at the label of problem_3 for example:
(gdb) b problem_3
Breakpoint 1 at 0x80000540: file src/level1_asm.s, line 115.
Then “coninute” run the program and it will automatically pause right before the breakpoint you just set:
(gdb) c
Continuing.

Breakpoint 1, problem_3 () at src/level1_asm.s:116
116     mv a0, zero # <- Replace this with your code
=> 0x80000548 <problem_3+0>: 00000513.   li  a0,0
The output means the next instruction to execute is at line 116 of level1_asm.s, which is assembly code mv a0, zero. In the binary, this line of code is compiled to a li a0, 0 instruction. We can then execute instruction one-by-one with “next” command:
(gdb) n
119     call problem3_target
=> 0x8000054c <problem_3+4>: 1d4000ef    jal 0x80000720 <problem3_target>
When the next instruction is a function call, “next” command will directly execute all instructions in the function until the function returns (You could try that!). However, we sometime might want to look into the body of function, which can be achieved with “step”:
(gdb) s
problem3_target (str=0x0) at src/level1.c:86
86      puts("Checking Problem 3\r\n");
=> 0x80000734 <problem3_target+20>: 800017b7    lui a5,0x80001
   0x80000738 <problem3_target+24>: 0dc78513    add a0,a5,220 # 0x800010dc
   0x8000073c <problem3_target+28>: 965ff0ef    jal 0x800000a0 <puts>
Note that, sometime, it stops only at the next line of C code in the function (instead of the next instruction in the binary), which is already the pc at <problem3_target+20>. To see what are the instruction between <problem3_target+0> and <problem3_target+20> that have been executed, use command x/8i problem3_target, where x means “examine memory”, 8 means “printing following 8 entries”, i means “format it as instructions”, and problem3_target is the address to print:
(gdb) x/8i problem3_target
   0x80000720 <problem3_target>:    add sp,sp,-32
   0x80000724 <problem3_target+4>:  sw  ra,28(sp)
   0x80000728 <problem3_target+8>:  sw  s0,24(sp)
   0x8000072c <problem3_target+12>: add s0,sp,32
   0x80000730 <problem3_target+16>: sw  a0,-20(s0)
=> 0x80000734 <problem3_target+20>: lui a5,0x80001
   0x80000738 <problem3_target+24>: add a0,a5,220
   0x8000073c <problem3_target+28>: jal 0x800000a0 <puts>
Now, to debug your solution of level 1.3, you might be curious what is the state (e.g., regfile, stack) of the processor and check whether you have filled the values correctly. You can do check regfile with “info registers”:
(gdb) info registers
ra             0x80000550   0x80000550 <problem_3+8>
sp             0x80101fd0   0x80101fd0
...
a0             0x0  0
a1             0x0  0
...
pc             0x80000734   0x80000734 <problem3_target+20>
You can see the stack pointer sp is 0x80101fd0. Then, you can print the value stored in this location with x/16w 0x80101fd0, where w means “format as a word”:
(gdb) x/16w 0x80101fd0
0x80101fd0: 0x00000000  0xf1e57fcd  0xdeadc0de  0x00000000
0x80101fe0: 0x00000000  0x00000000  0x80102000  0x80000550
0x80101ff0: 0x80102000  0x80000010  0x00000000  0x00000000
0x80102000: 0x00000000  0x00000000  0x00000000  0x00000000
Alternatively, x/8 $sp could print the same thing, saving you a Ctrl-c/Ctrl-v:
(gdb) x/16w $sp
0x80101fd0: 0x00000000  0xf1e57fcd  0xdeadc0de  0x00000000
0x80101fe0: 0x00000000  0x00000000  0x80102000  0x80000550
0x80101ff0: 0x80102000  0x80000010  0x00000000  0x00000000
0x80102000: 0x00000000  0x00000000  0x00000000  0x00000000
Now, you could start to modify the code for level 1.3 and check how the stack value is changed by your code. You can quit gdb with q.
Below summarize the commands we have used in gdb.
| Commands | Explanation |
|---|---|
| b label | Set a breakpoint at the label. |
| c | Continue until the next instruction is a breakpoint. |
| n | Step over a single instruction (skip function calls). |
| s | Step over a single instruction. |
| info registers | Examine register values. |
| x/8i addr | Examine memory starting from addr for 8 instruction entries. |
| x/16w addr | Examine memory starting from addr for 16 data word entries. |
| q | Quit gdb. |
You can learn more about GDB here or by googling some functions you expect from GDB.
Binary Exploitation and CTF Tools
Level 2-5
Level 2-5 guides you to build off from a buffer overflow to a return-to-win attack and then a ROP attack. These exercises will be useful in the fuzzing lab. When you get confused about what the assembly code is doing, refer to the GDB debugging section above. GDB is also needed for getting the stack pointer in level 5.
Privileged Extensions
We now provide additional materials for getting warm up for the fuzzing lab. Take a look at the RISC-V ISA Volume II. This manual provides an overview of the privilege modes available to RISC-V systems and how to transition between them. As you will recall from earlier labs, the OS kernel runs in a higher privilege level than user programs – this volume describes that mechanism on RISC-V. In the fuzzing lab, you will be writing programs that run with higher privilege levels, and will write code to handle privilege transitions (AKA exceptions).
Privilege Levels
There are 4 privilege levels in the RISC-V ISA, of which two of them we will use in our labs.
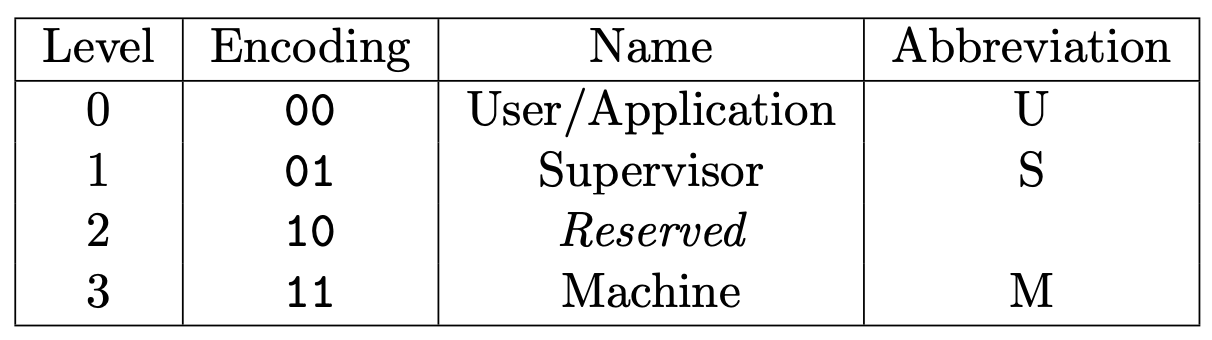
Table 1.1 from the RISC-V ISA Volume II: RISC-V privilege levels.
For the sake of this class, we will use the convention that level 0 (U mode) is userspace, and level 3 (M mode) is kernelspace. In the fuzzing lab, these privilege modes will be referred to as PSP_PRIV_USER and PSP_PRIV_MACHINE, respectively.
Levels 1 and 2 are not used in this class.
Control and Status Registers (CSRs)
Control and Status Registers (CSRs for short) are special privileged CPU registers that configure how the CPU behaves. They can be read/ written with the csrr, csrw, and csrrw instructions while operating in M mode.
| Instruction | Example | Usage |
|---|---|---|
csrr- CSR Read | csrr x1, SOME_CSR | Read SOME_CSR into register x1. |
csrw- CSR Write | csrw SOME_CSR, x1 | Write x1 into SOME_CSR. |
csrrw- CSR Read and Write | csrrw x1, SOME_CSR, x2 | Read SOME_CSR into register x1 and simultaneously write x2 into SOME_CSR. |
One of the most important CSRs is mepc (CSR address 0x341). When an exception occurs, the current PC of the faulting instruction will be written into mepc. mepc can be read by system software using the csrr instruction.
mepcwill contain whatever the PC was at the exception, regardless of what mode the CPU was previously in.
Exception Conditions
Whenever a RISC-V CPU encounters an exception condition (perhaps dividing by zero, a usermode program attempts to perform an illegal access, or an undefined instruction is executed), the CPU will execute a privilege transition into machine mode.
Recall in lecture when Mengjia introduced the SYSRET bug on x86_64 machines:
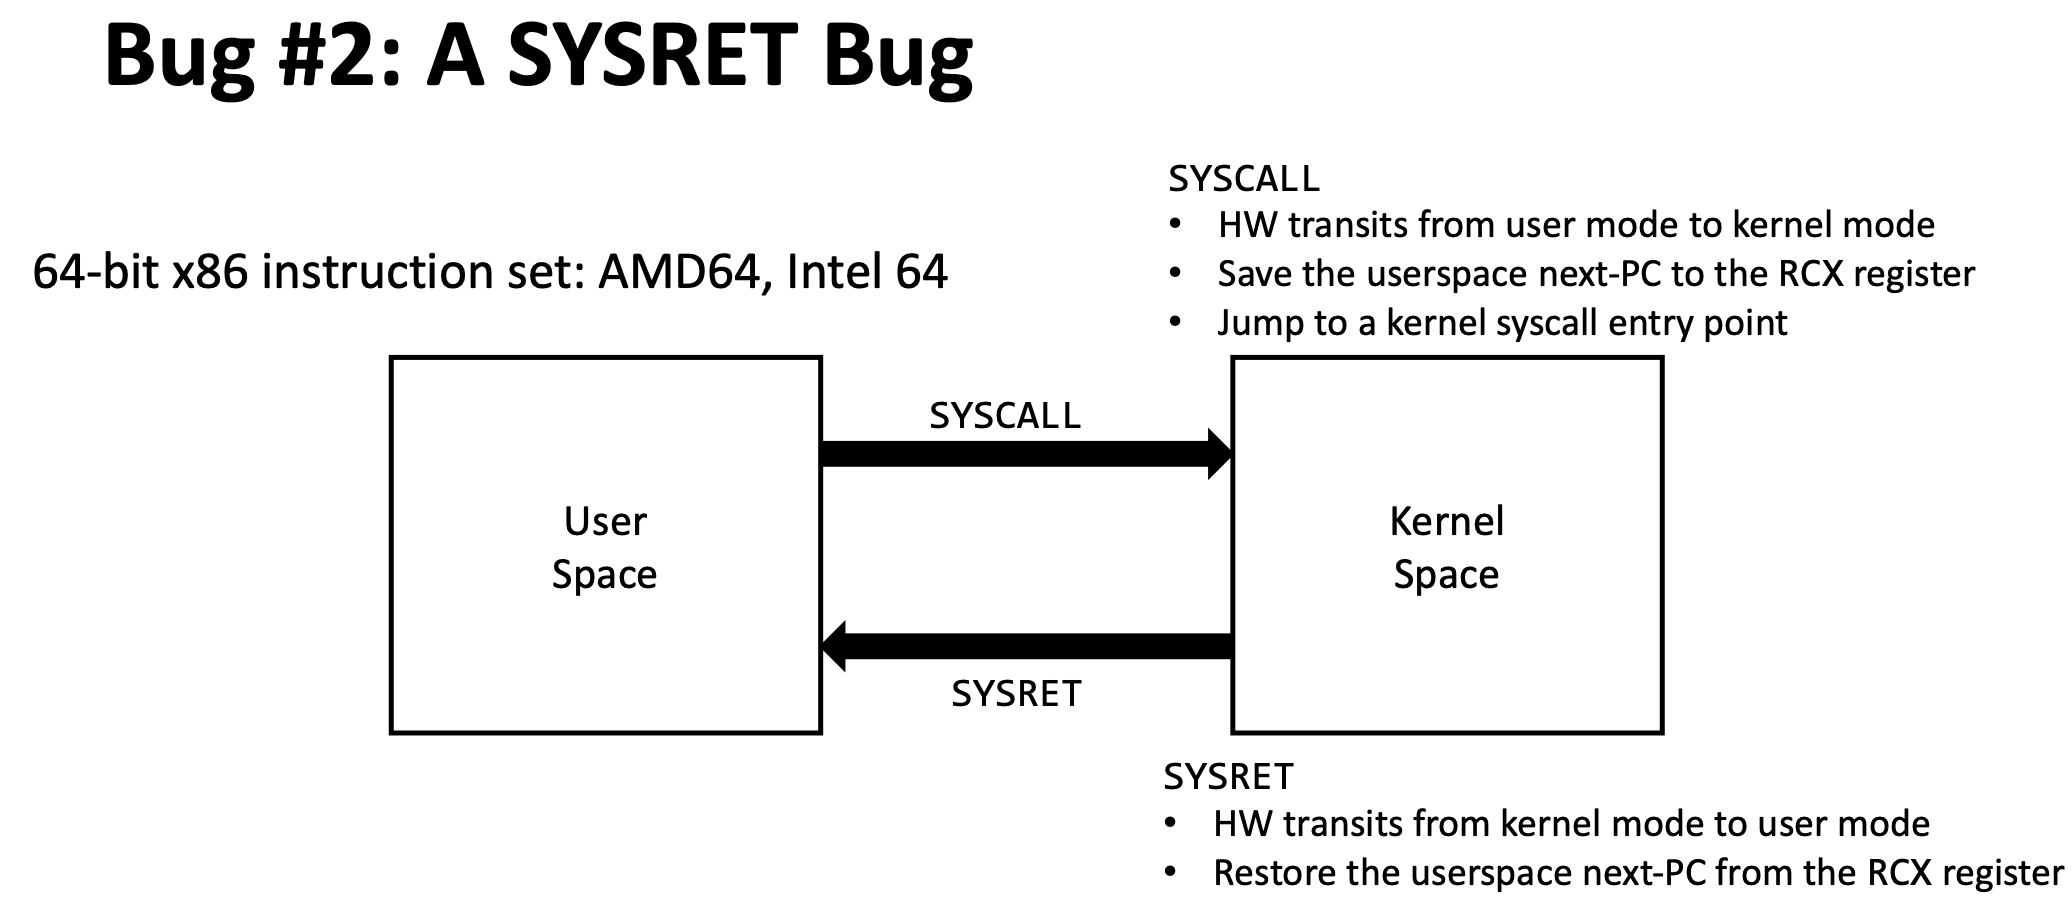
This is how x86_64 machines perform privilege transitions (specifically, when a system call is requested). On RISC-V, there exists a very similar mechanism for privilege transitions!

The exception handler is the code in the kernel that is executed on an exception condition. In the fuzzing lab, you will write one!
Hands-on Puzzles
Check out the hands-on puzzle repository for 5 introductory RISC-V programming activities. These exercises will get you familiar with writing RISC-V assembly and the calling convention, as these topics will be useful in the fuzzing lab.